
(X,Y) Coordinates in Labvanced
XY-coordinates Overview
Using X,Y coordinates are essential in research and have endless applications. They can be used for many things like gathering data and reporting mouse tracking across time, setting up events / conditions for something to happen, or as the basis for designing the experiment. To get a feel for how (X,Y) coordinates are handled in Labvanced, read on!
X,Y coordinates from a multi-user study where an image was being dragged by a participant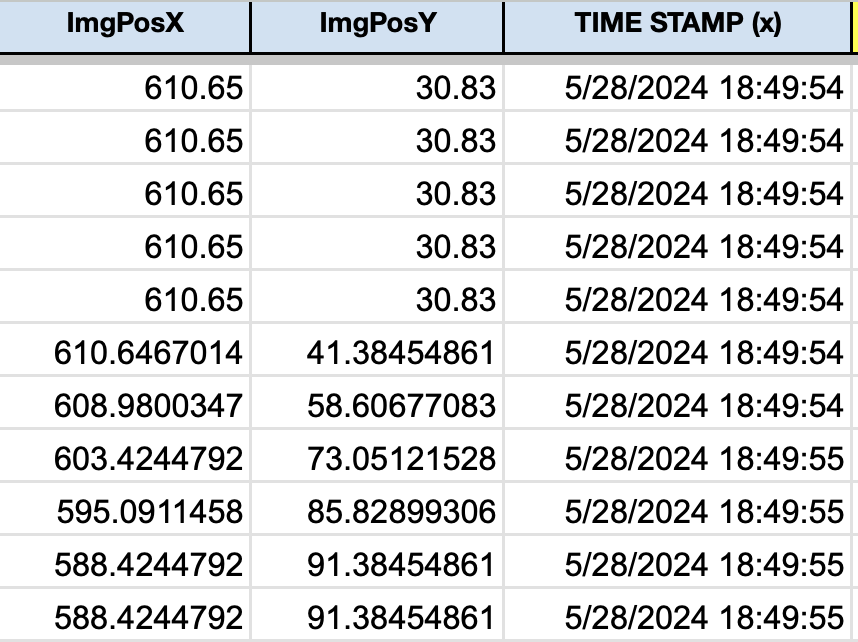
(X,Y) Coordinates in the Editor
First, let’s create a square and place it in the bottom left corner. As you can see, this shape takes the size of one of the shapes in the editor’s background grid (which can be activated by clicking the ‘Grid’ option at the bottom).
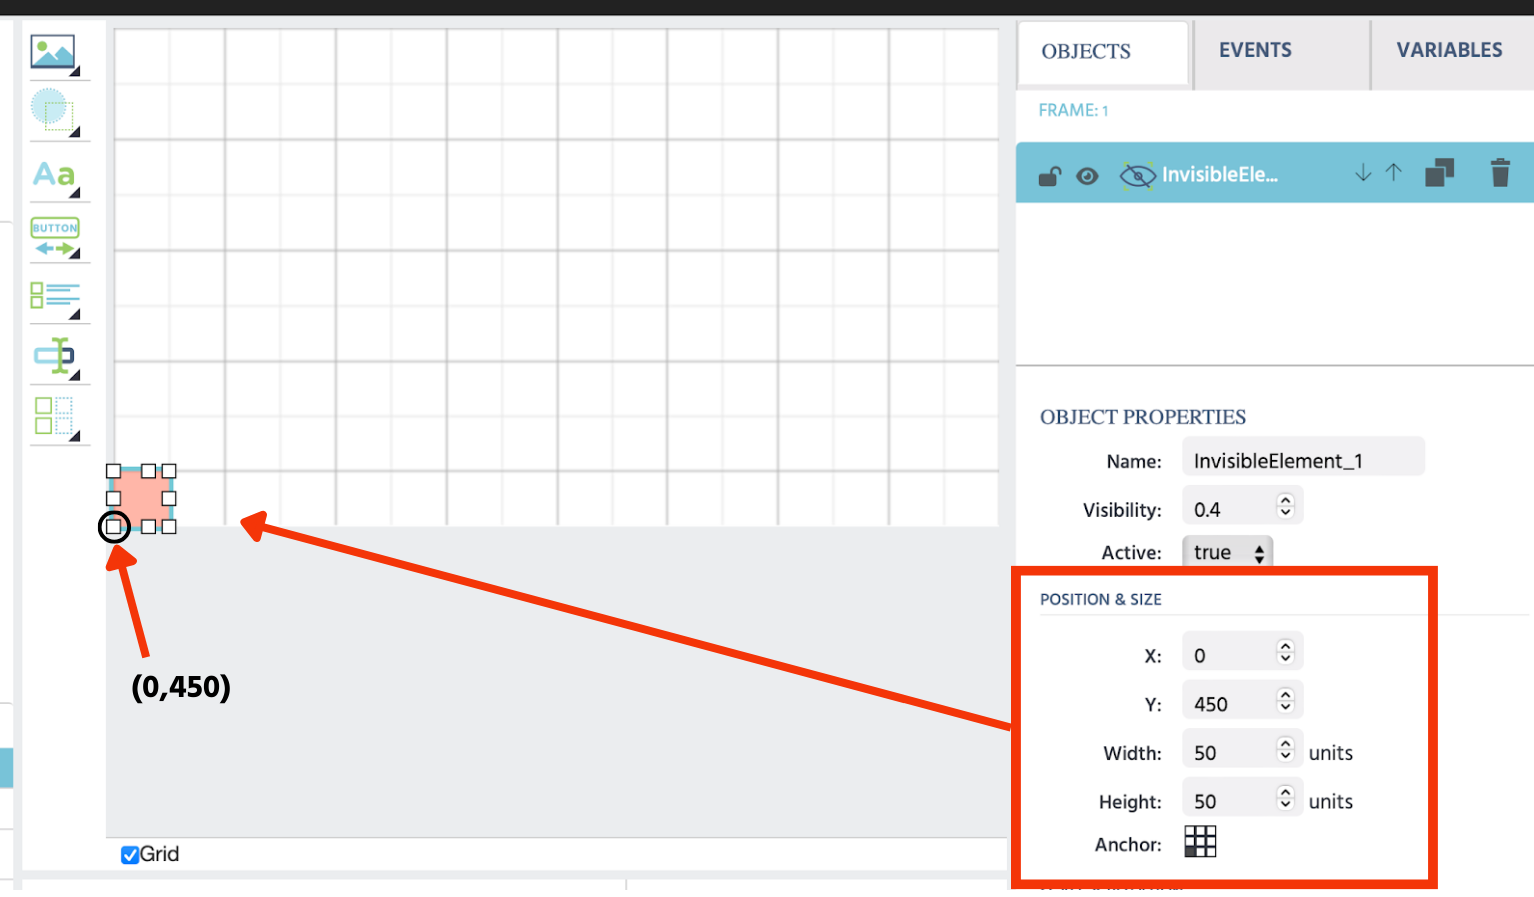
On the right panel, the relevant subsection for us is the ‘Position & Size’ menu where the square’s x-value, the y-value, the width/height is reported, as well as the anchor point. The anchor point is important because it is used to specify which (X,Y) coordinate value is reported on the shape / object. Based on the side menu values, we can conclude that the size of the square is 50 units wide + 50 units high - thus each square on this grid/canvas is 50x50 units.
Since the anchor point is the point for which the (x,y) coordinate is reported, we know the coordinates of the square’s bottom left corner are (0,450). At this point, you might be wondering why it is not (0,0). This is because Labvanced works online and HTML renders from the top down. Later, we will give you an idea for how to account for this if you need to have this value equal to (0,0) for your research.
Now, let’s create another larger shape to continue working with (X,Y) coordinates within the editor canvas. .
Using the same reasoning we followed previously, we can see the coordinates for the top-left corner are (100,50).
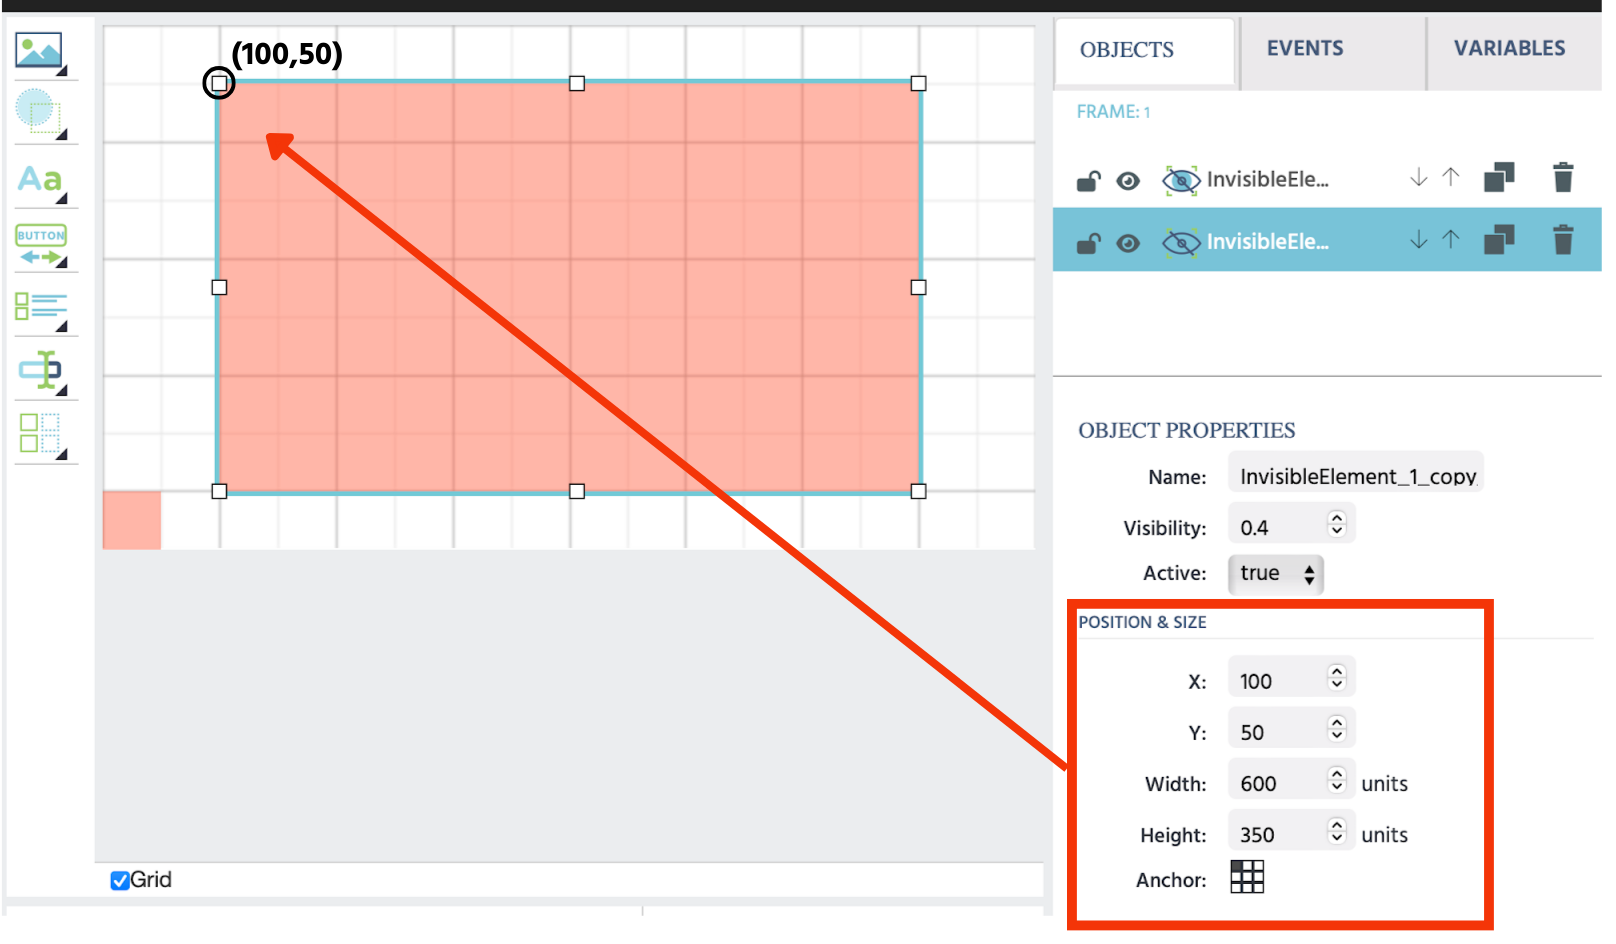
Please note that we selected the relevant anchor point in order to see this value.
Since we know that each small grid square in the background is 50x50 units, we can also confirm this visually, by counting 2 small squares to the right and 1 small square down.
Potential Method for Setting the Origin as (0,0)
As mentioned previously, conceptualizing the ‘origin’ as the point where the x- and y-axises meet on the canvas frame yields a coordinate point of (0,450). This is simply because Labvanced works on the browser and this is how HTML renders.
Thus, if for whatever reason, you need this point to be read out as (0,0) you can set up a variable and event in Labvanced that takes the y-value and subtracts 450 from it. By setting up such a ‘transformation’ then the data collected (such as for mouse tracking time series) can automatically be adjusted based on a (0,0) origin.
(X,Y) Coordinates Within a Specified Plane
In some other cases, you might need to report the (X,Y) coordinates solely within a ‘plane’ that you specify… ie, the origin is not the lower-left point on the canvas but rather a point that you want to specify within your own plane / field. Let’s discuss how this can be done.
Using the big red shape we drew previously as the new ‘area of interest,’ we can define how this shape fits within the main canvas frame by observing that:
- Horizontally, 100 units is the distance between where the canvas frame starts and where the target red plane starts
- Vertically, 400 units is the distance between where the canvas frame starts and where the target red plane ends.
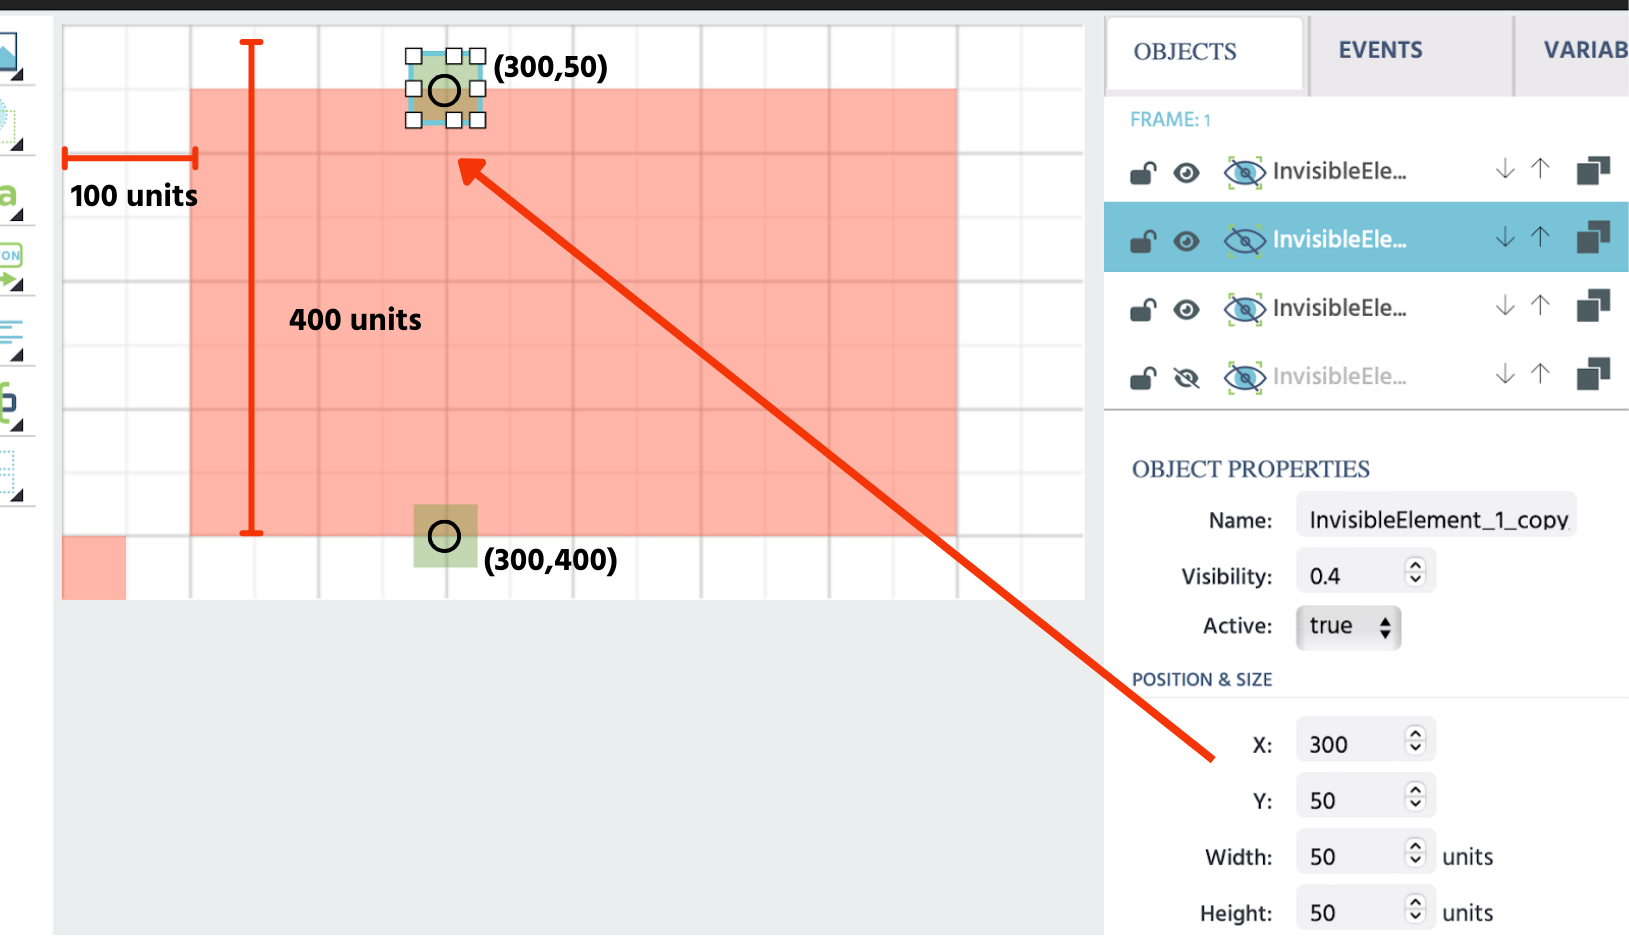
Thus, while the coordinates of the top green box are (300,50) within the canvas frame, we can ‘transform’ to reach the ‘new value’ in the target plane which would be (200,350)... ie, x= 300 - 100; y= 400 - 50
You can confirm this simply by counting 4 boxes to the left and 7 boxes up.
Similarly, for the bottom green box, the new values would be (200,0).
In this final example, let’s pick a random point. It is reported with decimal values which is what data in an experiment would look like.
The new purple square has the coordinates of (465.61, 295.88) within the canvas frame.
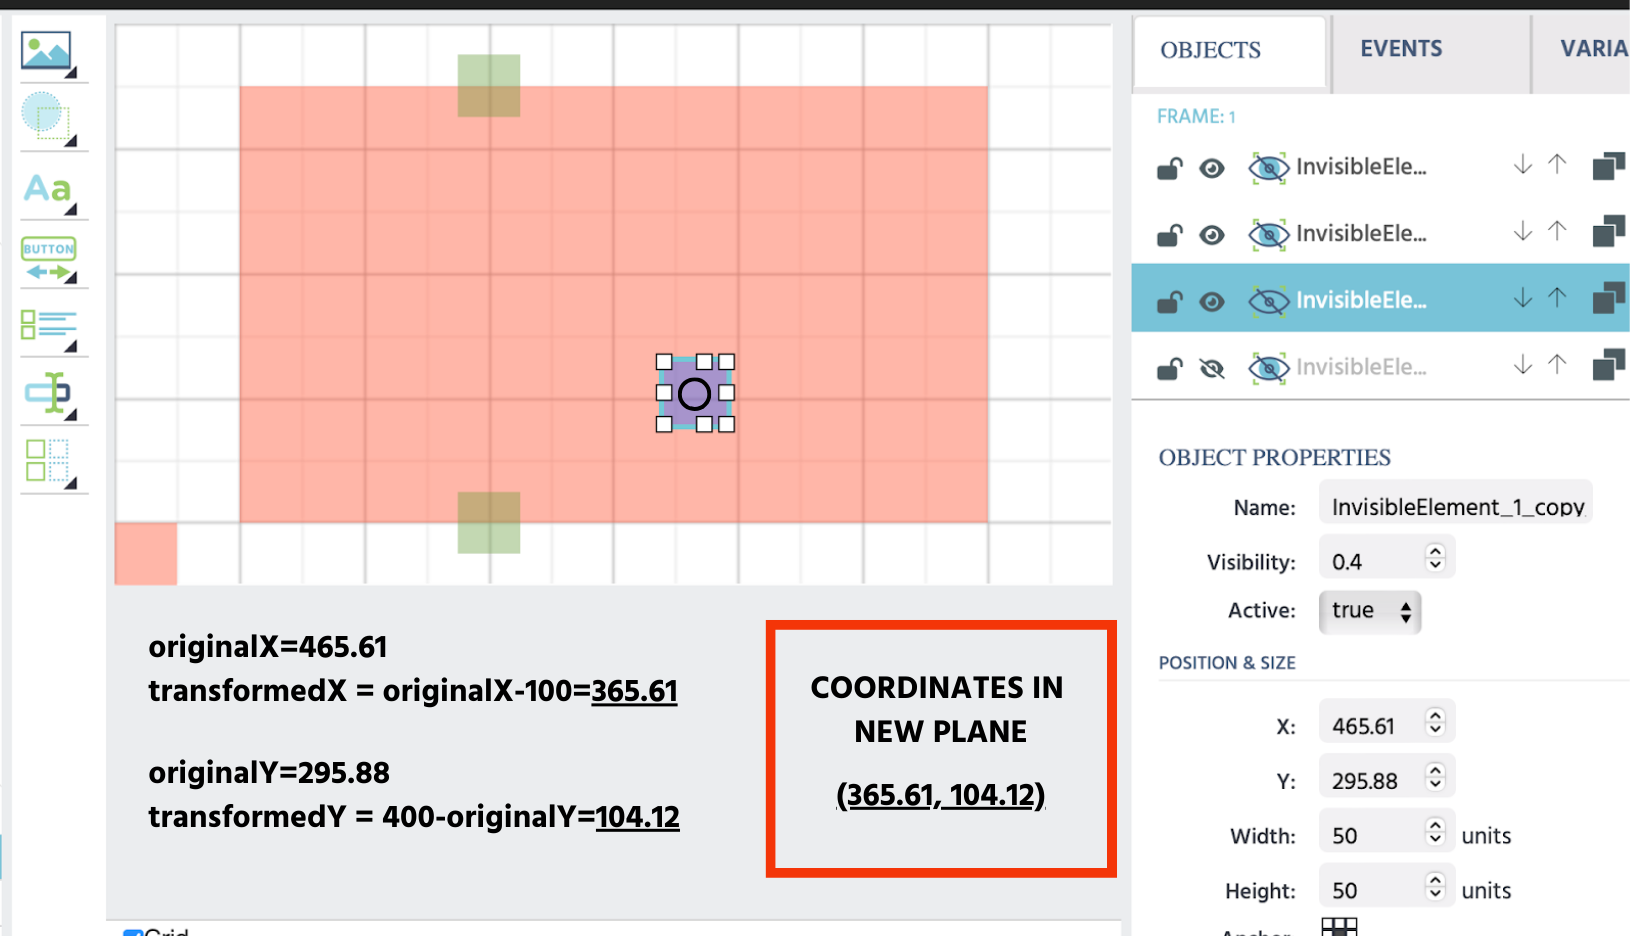
To find out what these points are within the target red frame, we do the same thing:
- TransformedX = 465.61 - 100 = 365.61
- TransformedY = 400 - 295.88 = 104.12
Coordinates in the new plane = (365.61, 104.12)
Please note that, in Labvanced, as mentioned previously, you can set up these calculations to happen automatically so you can receive all the (x,y) values in the original frame, as well as all the transformed (x,y) values in your target frame.
If you have any questions about (X,Y coordinates) or setting up your experiment with Labvanced, please contact us!
Continue Reading
- Eye Tracking in a Task: Overview of how eye tracking is used in experimental tasks, including recording (X,Y) coordinates of gaze locations.
- Head Tracking in a Task: Overview of how head tracking is used in experimental tasks, including recording (X,Y) coordinates of head position.